
In this article, we test the impact of W3 Total Cache’s Full Site Delivery (FSD) feature on website performance using Loader.io. We’ll show how enabling FSD can significantly improve response times, scalability, and server load, leading to a better experience for both users and administrators.
What is Full Site Delivery?
Full Site Delivery (FSD) is an advanced type of Content Delivery Network (CDN) that improves website performance by delivering entire web pages—HTML, JavaScript, CSS, images, and other assets—directly from the CDN. Unlike traditional CDNs that only cache static assets, FSD caches and serves the entire HTML of the page, reducing the load on your origin server. This means that nearly all the work is handled by the CDN, and your origin server (your web host) experiences minimal traffic. As a result, users receive content much faster since it’s delivered from a server closer to them, rather than from a distant origin server. Faster load times lead to lower bounce rates and higher user engagement.
A Scientific Approach to Testing Full Site Delivery
To accurately measure the impact of W3 Total Cache’s Full Site Delivery (FSD) feature, we’re following a structured, scientific method. This involves setting up both a control website and an experimental website, allowing us to compare performance under identical conditions. The control site remains untouched, providing baseline performance data, while the experimental site has FSD enabled to assess its effectiveness.
Below, we detail the setup of both websites and the results of our testing.
Control Website
Our control website is a basic WordPress installation using the Twenty Twenty-Four theme, with no additional plugins or custom functionalities enabled. The purpose of this site is to establish a baseline for page load scores before adding W3 Total Cache and enabling the Full Site Delivery feature.
Control Website: https://wordpress-speed-test.com/060524/
Experimental Website
We duplicated our control website onto a subdomain to create an experimental version that mirrors the original. This allows us to compare load averages between the two sites side by side.
Experimental Website: https://fsd-after.wordpress-speed-test.com/
In this test, using the W3 Total Cache Full Site Delivery (FSD) feature added a 98.58% performance enhancement to the Average Server Response Time! Read the documentation to learn how to use the Full Site Delivery (FSD) pro feature.
Upgrade to W3 Total Cache Pro and improve your PageSpeed Scores today!
Experimental Website Setup
We enabled Bunny CDN, our recommended FSD network, from the W3 Total Cache “General Settings” page and ensured it was authorized and functioning correctly on the experimental site.
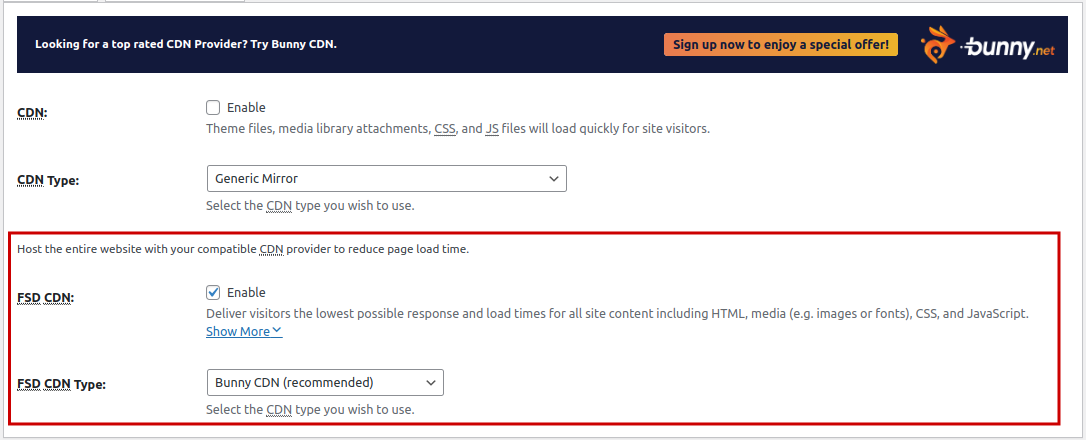
To confirm that Bunny CDN and Full Site Delivery are enabled, navigate to the CDN section. At the top of the page, look for the full-site-delivery message to verify that FSD CDN support is active and authorized.
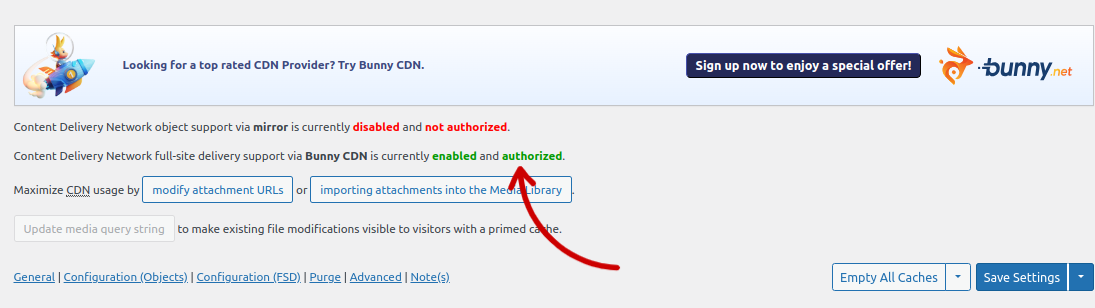
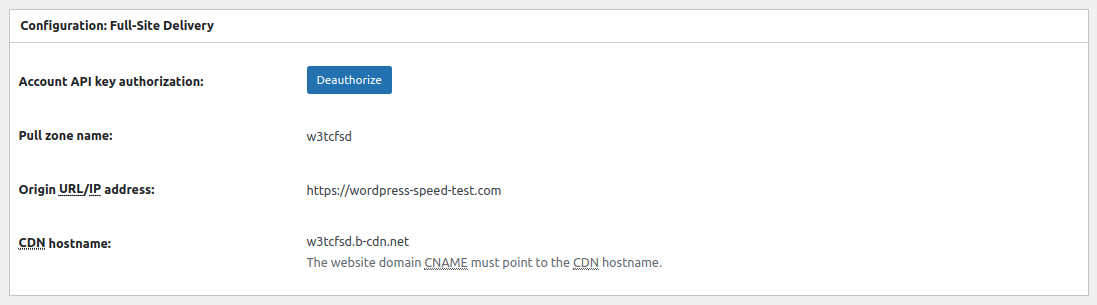
Scrolling down, you’ll find the Configuration: Full-Site Delivery section. This section contains details from the Bunny CDN Pull Zone we just created.
Testing Full Site Delivery under Heavy Traffic with Loader.io
To measure the impact of Full Site Delivery (FSD) under heavy traffic, we ran simultaneous tests on both the control and experimental sites using Loader.io. Our goal was to evaluate server response time and load under intense conditions. The test simulated 2,500 clients making identical requests over a 60-second period.
Control Website Results
- Test Conditions: 2,500 clients over 60 seconds
- Average Response Time: 2,319 ms
- Successful Requests: 2,319 out of 2,500
All visitors were able to submit requests without errors. However, due to the high average response time, only 2,319 requests were completed within the 60-second period.
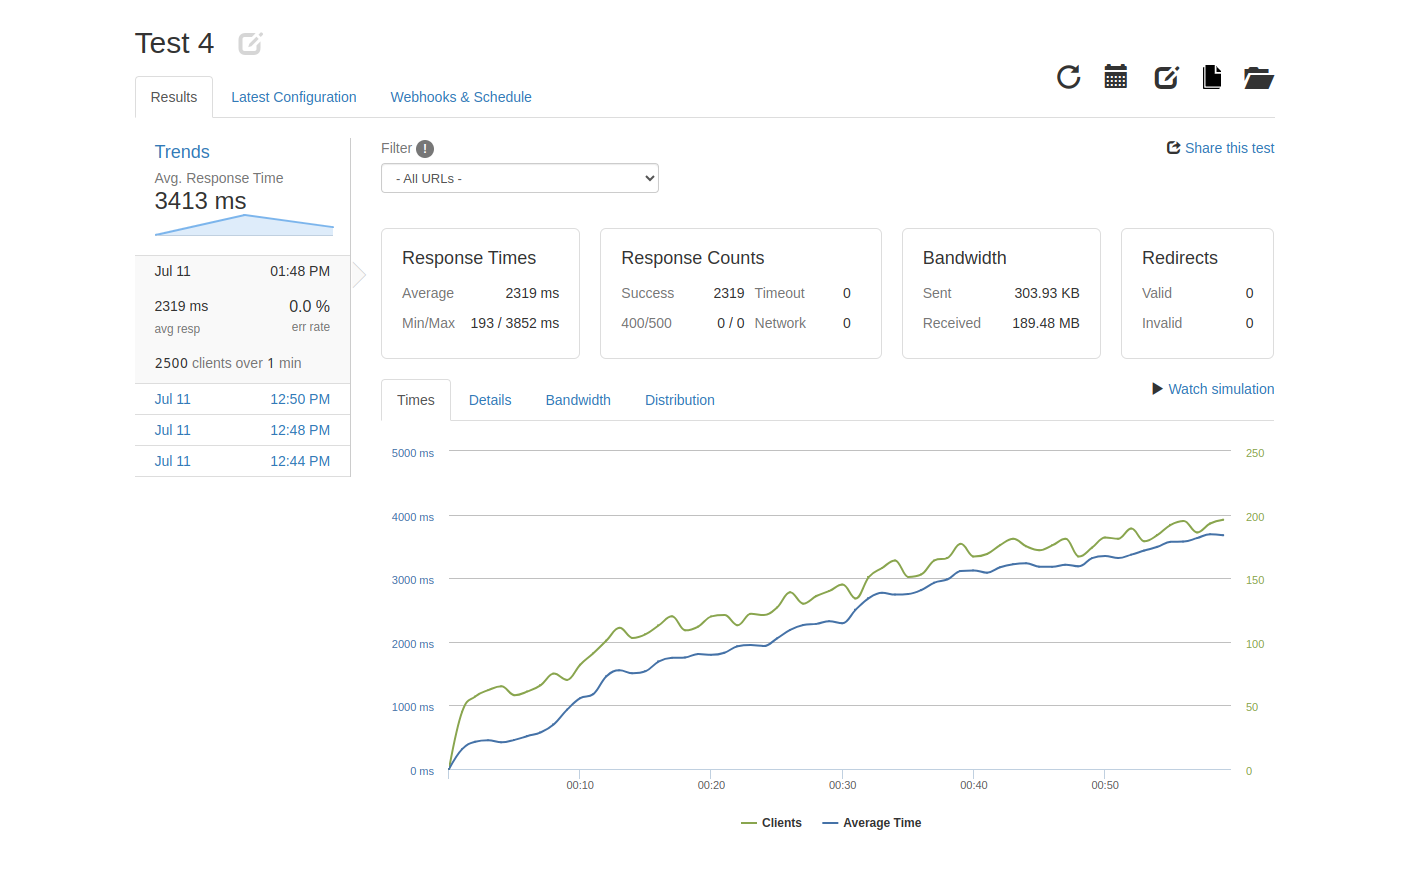
Server Load: We recorded the server’s load average and created a chart to visualize the test’s impact. As the test progresses and more client requests are made, you’ll notice a steady increase in load averages.
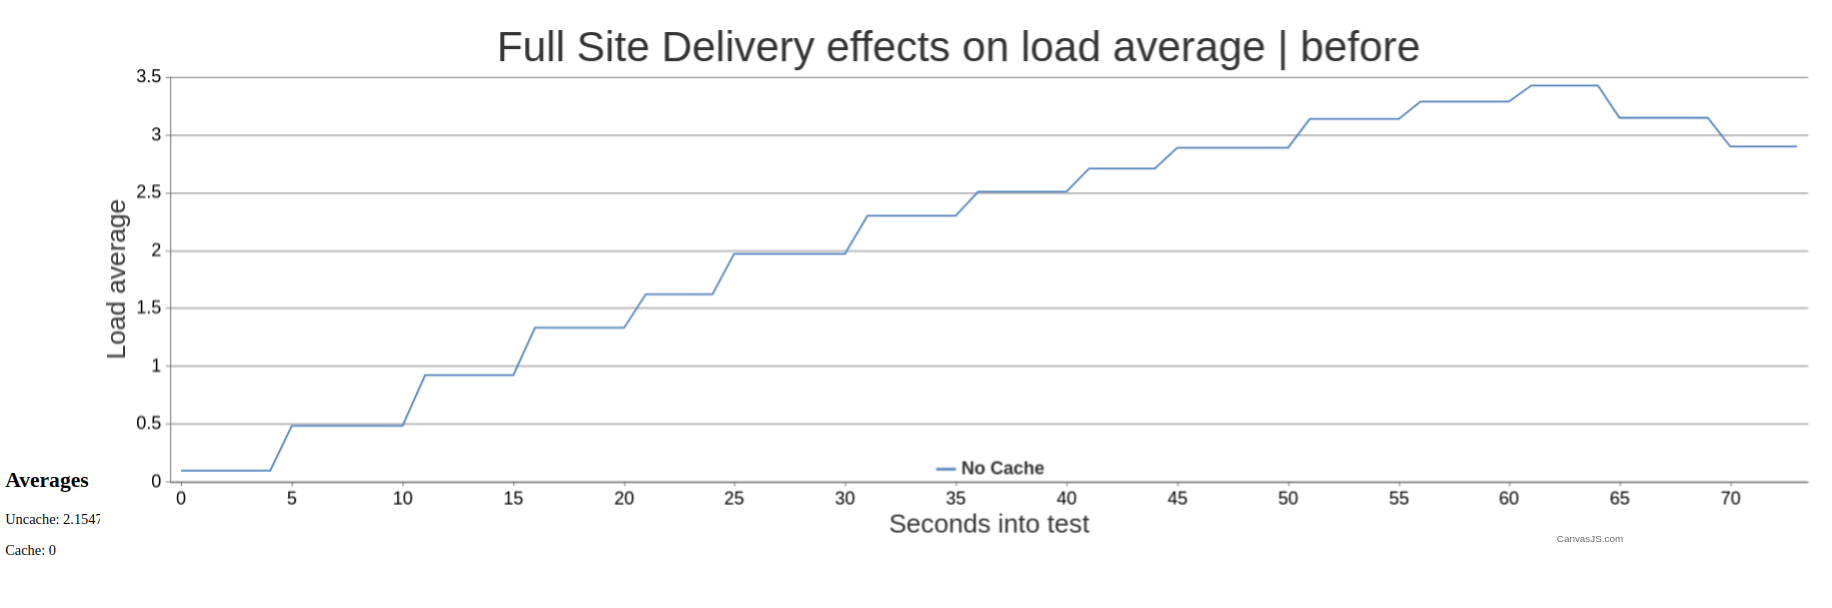
The server’s load average steadily increased as more client requests were made. This rise in load reflects the server’s struggle to handle the growing number of requests.
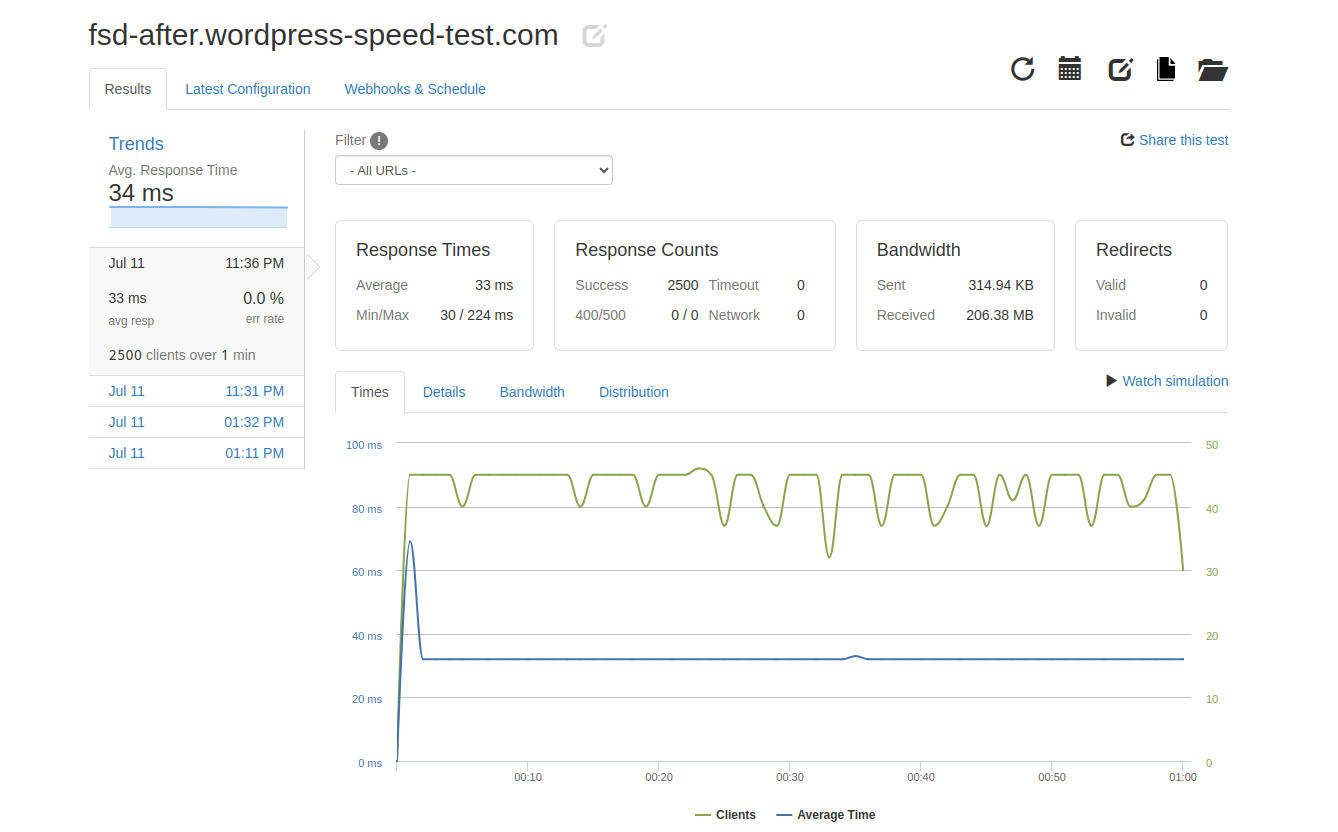
Experimental Website Results with Full Site Delivery
- Test Conditions: 2,500 clients over 60 seconds
- Average Response Time: 33 ms
- Successful Requests: 2,500 out of 2,500
Similarly, all visitors to the experimental site were able to submit requests successfully without errors. Notably, the response time for each request was significantly faster, averaging just 33 ms. The experimental site processed all 2,500 requests within the 60-second period, demonstrating the efficiency of Full Site Delivery.
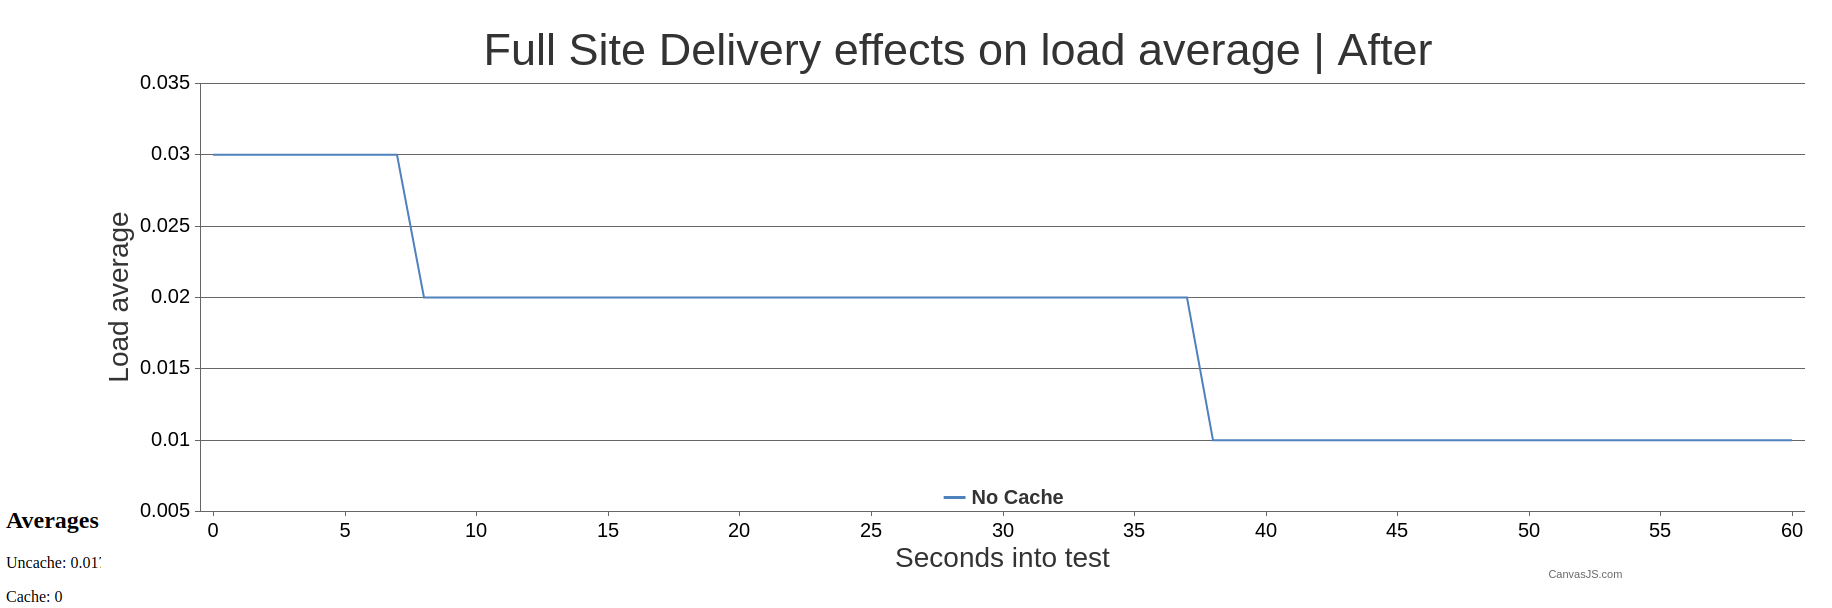
Server Load: Unlike the control site, the load average on the experimental site decreased over time. This suggests that requests were handled by the Full Site Delivery CDN rather than the origin server, significantly reducing the server’s load.
Results
Average Response Time
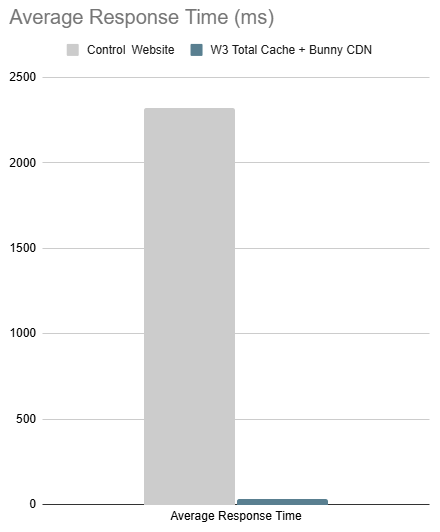
This graph shows how the average response times changed before and after using Full Site Delivery (FSD). Before FSD was enabled, the response time was 2,319 ms, meaning the server was slower to respond under heavy traffic. After enabling FSD, the response time dropped to just 33 ms, showing a huge improvement in speed. This change demonstrates how FSD helps speed up the site by using a CDN, reducing the load on the server and making the site faster for users.
Higher Request Handling Capacity
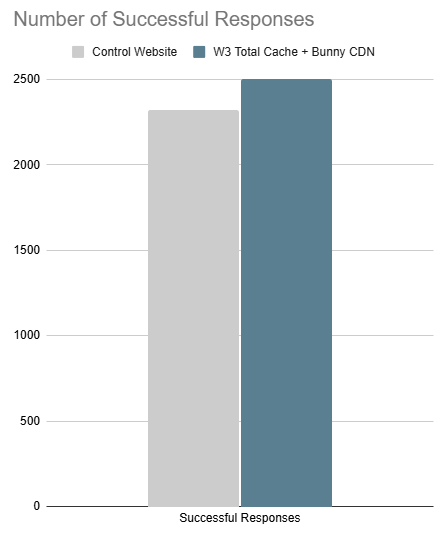
The graph shows that the experimental site completed all 2,500 requests within the 60-second period, while the control site only handled 2,319 requests. This represents a 181-request (7.81%) improvement in successfully handled requests, demonstrating how Full Site Delivery (FSD) enhances the site’s scalability and efficiency.
Average Server Load
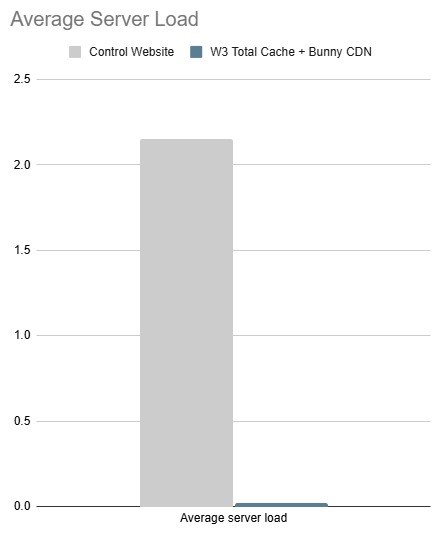
During testing, we monitored the server load on both websites. The control website had an average server load of 2.15, indicating a significant strain on the server under heavy traffic. In contrast, the experimental website’s server load averaged just 0.02, highlighting how Full Site Delivery (FSD) greatly reduced the load by offloading traffic to the CDN. This dramatic difference shows how FSD helps improve site performance by easing the burden on the origin server.
Key Takeaways
The Loader.io test results clearly highlight the benefits of using Full Site Delivery with Bunny CDN. By cutting down response times and significantly lowering server load, FSD helps your website manage high traffic more efficiently. This leads to faster load times and greater reliability. As a result, not only does the user experience improve, but your site also becomes more scalable and stable, capable of handling future traffic spikes with ease.
In this test, using the W3 Total Cache Full Site Delivery (FSD) feature added a 98.58% performance enhancement to the Average Server Response Time! Read the documentation to learn how to use the Full Site Delivery (FSD) pro feature.
Upgrade to W3 Total Cache Pro and improve your PageSpeed Scores today!
7 Month Update
The test results you see above are from July 2024. Now, 7 months later in February 2025, in full transparency, we are sharing these test results in other places online and wanted to run the tests again to verify the results.
Control Website
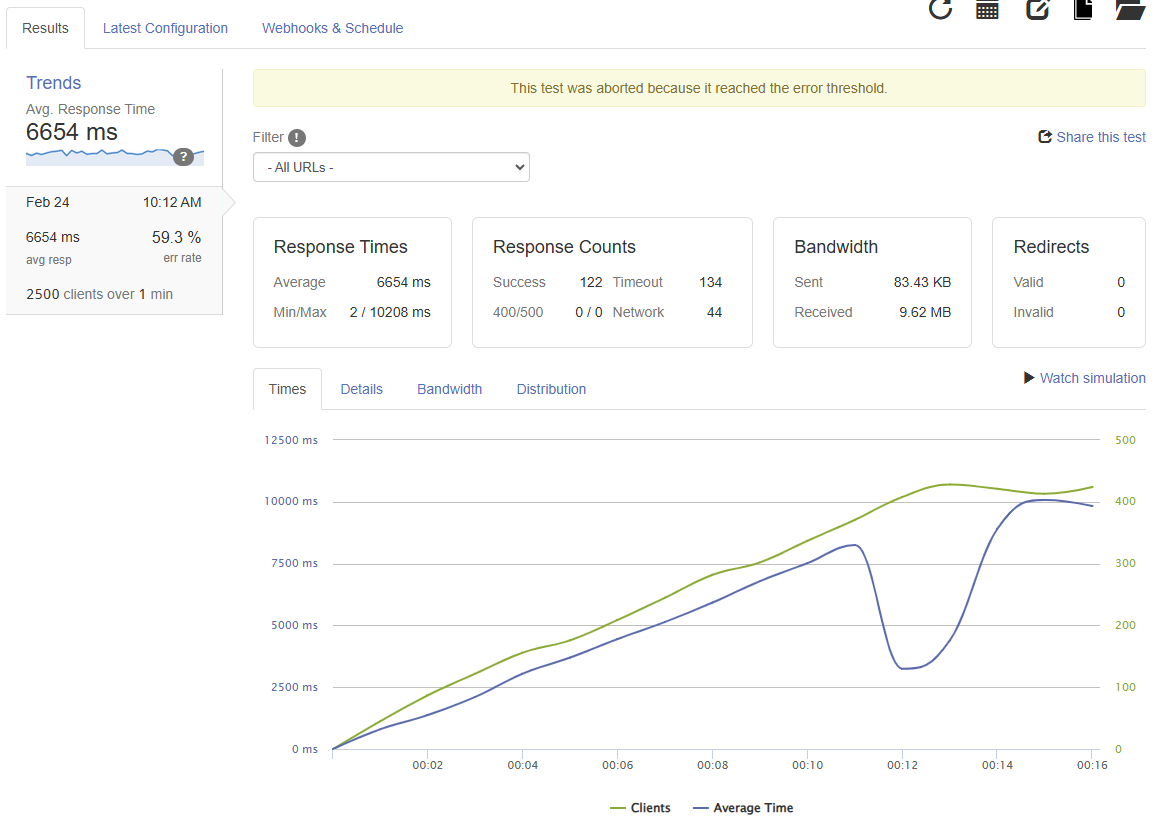
We started by testing our control website. We configured the test to send 2,500 clients over 1 minute. What was different this time, as you can see below, is that the tests didn’t complete because they reached an error threshold. This means that during the 1-minute period of sending 2,500 clients, too many timeout and network errors occurred to continue the test.
Cancelling a test midway is sometimes done when too many errors are received to prevent the server from actually crashing due to excessive requests, similar to a DDoS attack.
In the first test, only 122 of the 2,500 goal clients were successful in requesting the control website. The average response time was 6,654 ms.
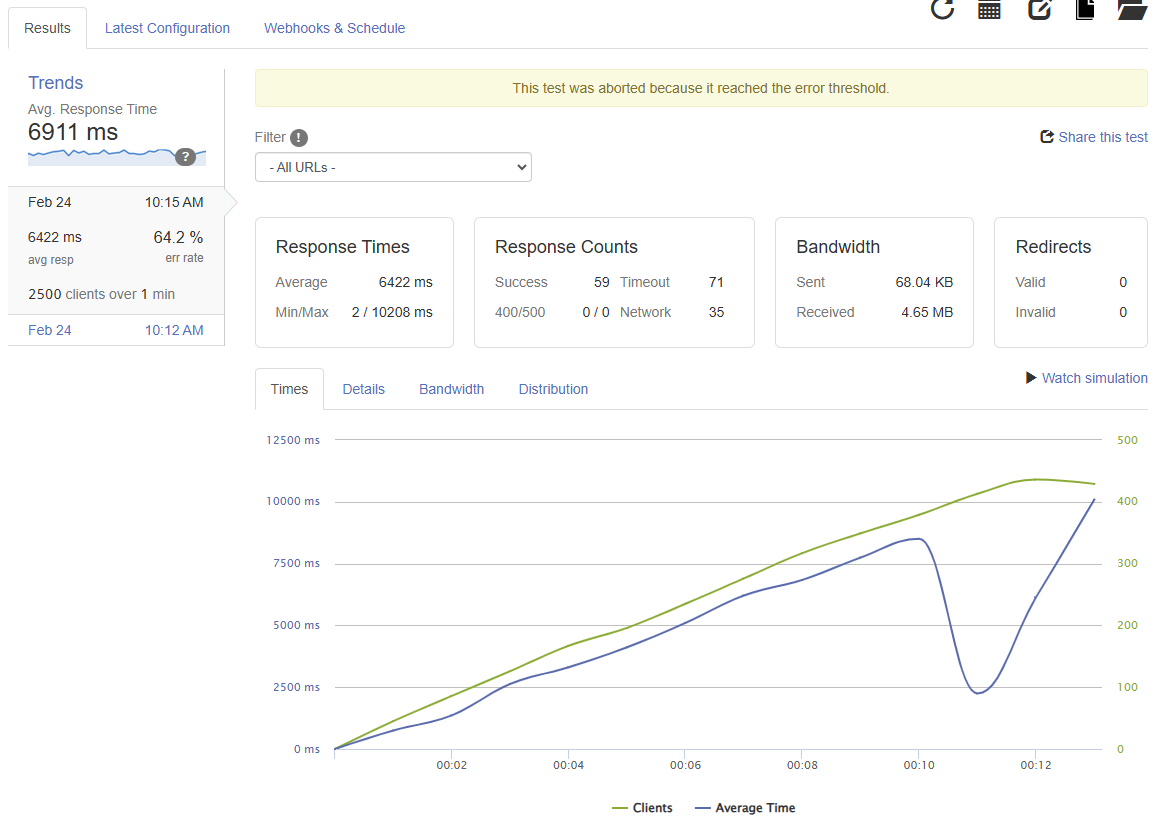
To ensure this wasn’t a fluke, we ran the same test again on the control website. This time, again, the test was aborted due to reaching an error threshold. In this attempt, only 59 out of 2,500 goal clients were successful, with an average response time of 6,422 ms.
Experimental Website
Next, we ran the same tests on our Full Site Delivery Experimental WordPress site. This is the website configured with HTML Caching and Object Caching (JS, CSS, etc.) through Bunny CDN.
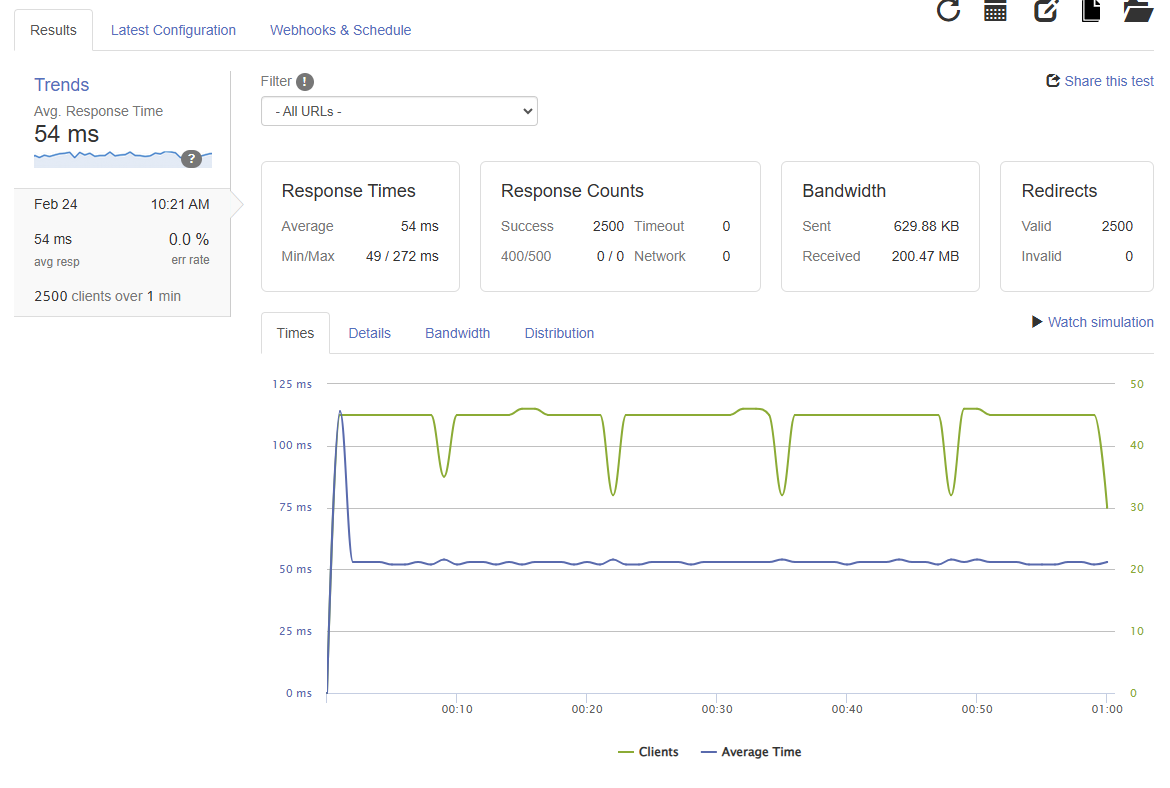
Unlike the 7-month-old control website tests, where drastic performance issues were seen, the Experimental website running with Bunny CDN once again performed flawlessly. All 2,500 of the clients successfully requested the Experimental website, with an average response time of just 54 ms.
7 Month Retest Conclusion
While we cannot definitively identify what caused the control website’s performance degradation (possible factors include changes at Loader.io, server configuration modifications, WordPress updates, etc.), these test results clearly demonstrate that typical servers struggle to handle high traffic volumes. Whether your website receives a sudden influx of visitors from popular platforms like Reddit or your product gains unexpected media attention, most standard server configurations cannot maintain performance under significant demand.
Implementing a CDN, particularly Full Site Delivery (FSD) through Bunny CDN, proves to be an excellent strategy for keeping your website both accessible and responsive even during massive traffic spikes. The dramatic difference in performance—with the experimental site handling all 2,500 client requests at just 54ms response time compared to the control site failing after just 59-122 successful requests—demonstrates the substantial benefits of this approach.
W3 Total Cache
You haven't seen fast until you've tried PRO
Full Site CDN + Additional Caching Options
Advanced Caching Statistics, Purge Logs and More
Everything you need to scale your WordPress Website and improve your PageSpeed.